
SDV System Monitoring Dashboards
Tools
Figma, FigJam, Visual Studio Code & UserTesting
Team
Spotfire Data Virtualization Team
(formerly TDV - Tibco Data Virtualization)
Role
Senior UX/UI Designer
Duration
2025 - 2026 Project
Project Overview
Spotfire Data Virtualization generates large volumes of operational data, but much of this information was only accessible through backend system tables and manual queries.
I led the UX for a new set of platform monitoring dashboards, working with engineers and stakeholders to identify the most important system metrics and translate them into actionable views of platform activity, performance, and usage.
The goal was to help administrators understand what was happening across the system, identify unusual activity, and investigate performance issues without relying on manual queries.
Design Process
Problem
Administrators relied on backend system tables and manual queries to understand platform activity and investigate performance issues.
The need for better visibility was already clear: some customers had created their own internal monitoring dashboards because the product did not provide an easy way to understand this information.
The challenge was to turn complex system metrics into an experience that helped users:
Understand overall platform health and activity
Identify spikes, unusual behavior, and performance issues
Move from high-level metrics into more detailed investigation
Understand system behavior without writing manual queries

Defining What to Monitor
I worked with engineers and stakeholders to understand the available system data and identify which metrics would be most useful for monitoring platform activity.
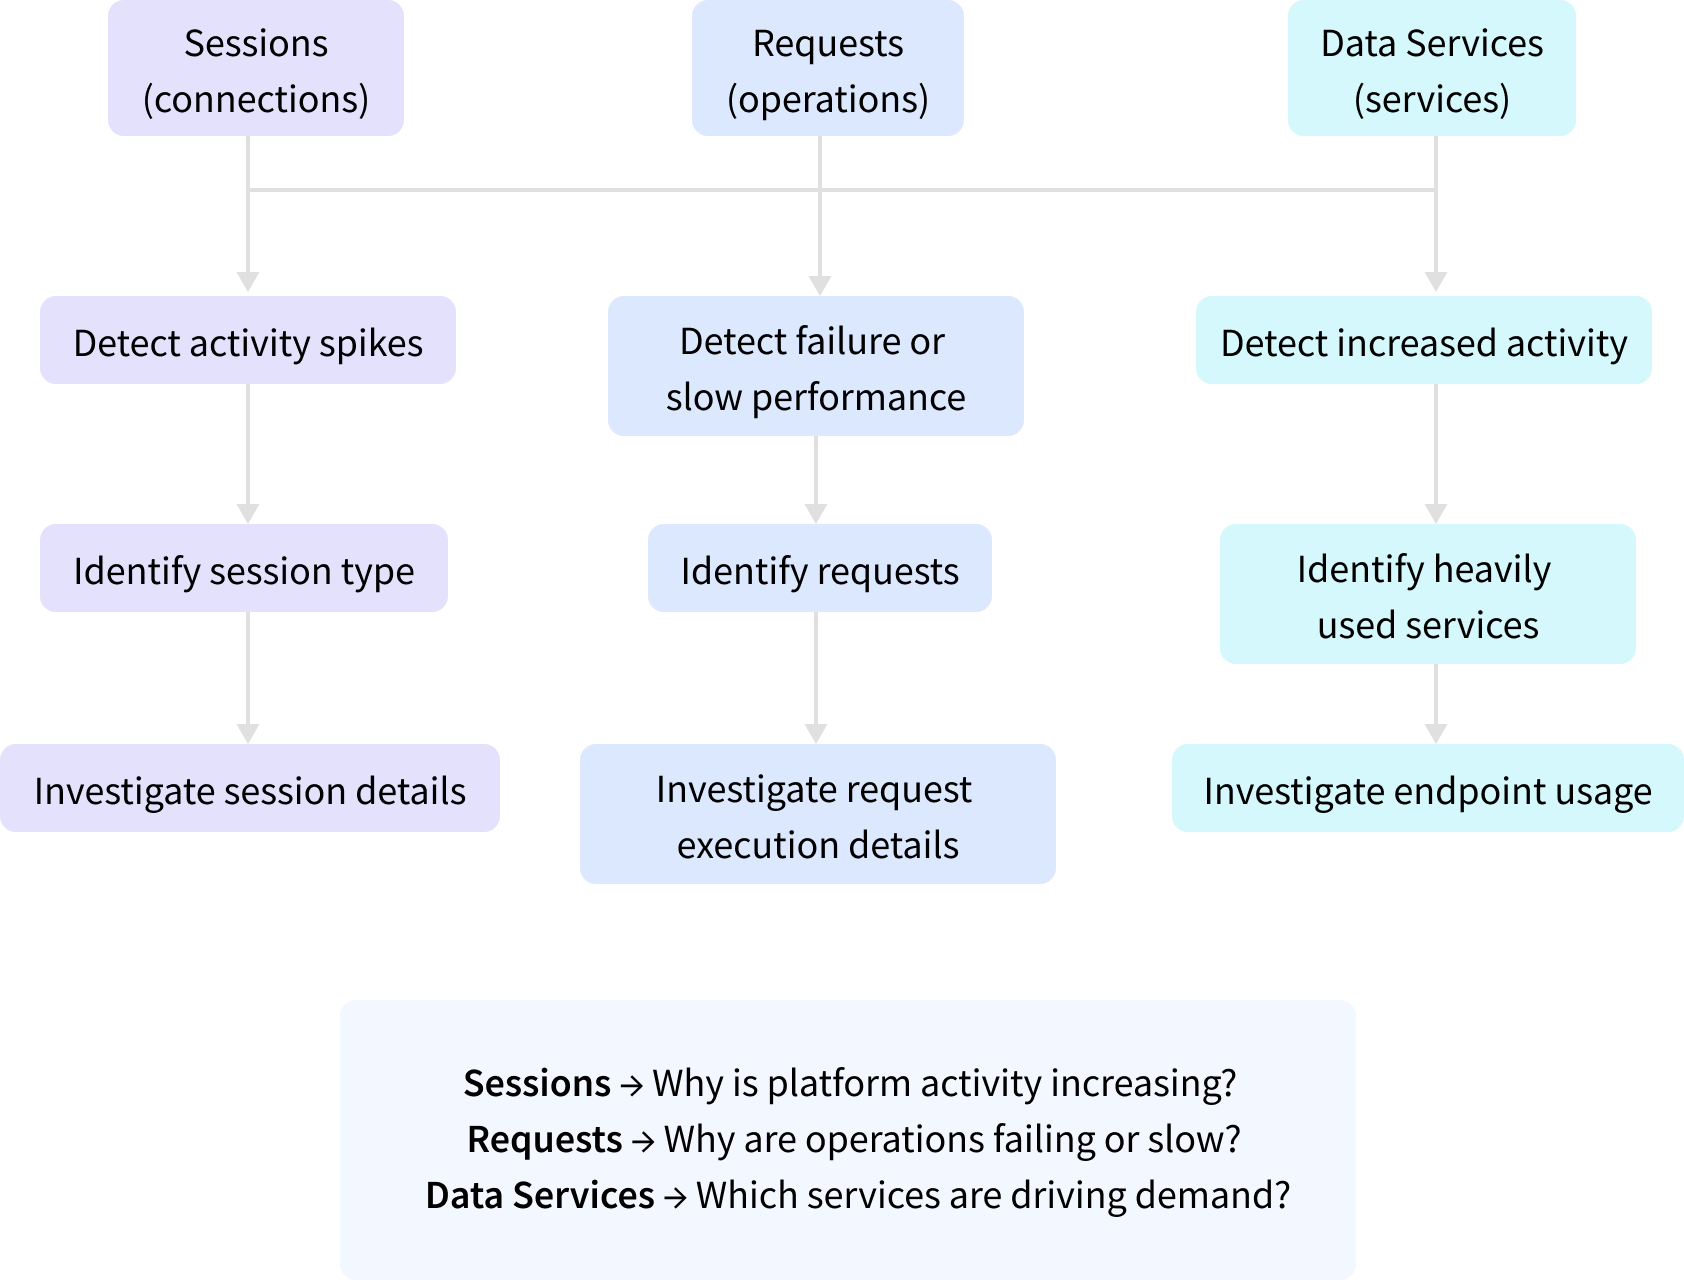
We organized the experience around three key areas:
Sessions — how users are connecting to and interacting with the platform
Requests — system workload and query activity
Data Services — how services are being used across the platform
This gave each dashboard a clear purpose while creating a consistent monitoring experience across the product.
Designing the Monitoring Experience
I designed the dashboards around a progressive investigation workflow, allowing users to start with high-level system activity and move into more detailed information when something required attention.
The experience combined:
KPIs for quickly understanding current system activity
Trends over time for identifying changes and unusual patterns
Live and historical data for understanding both current and past behavior
Drilldowns for investigating activity at a more detailed level
The goal was not just to visualize metrics, but to help users move from “What is happening?” → “Where is the issue?” → “What should I investigate?
Impact
The dashboards transformed system data that previously required manual queries and backend knowledge into an accessible monitoring experience.
They gave administrators a faster way to:
Understand platform activity and performance
Identify spikes and unusual behavior
Investigate potential performance issues
Reduce reliance on manual system queries
The project also established a scalable foundation for expanding platform monitoring and observability across Spotfire Data Virtualization.
Confidential Project Details!
This feature is part of an upcoming release and has not yet been made public - VIEW FULL CASE STUDY.
Access to the detailed case study and design specifications is password-protected.
The password is included with the resume submission. If you cannot access the project, please email: - seidakhmetovas@gmail.com